Greenhouse gas remote sensing: from space, the sky, and the surface by Niel Humpage
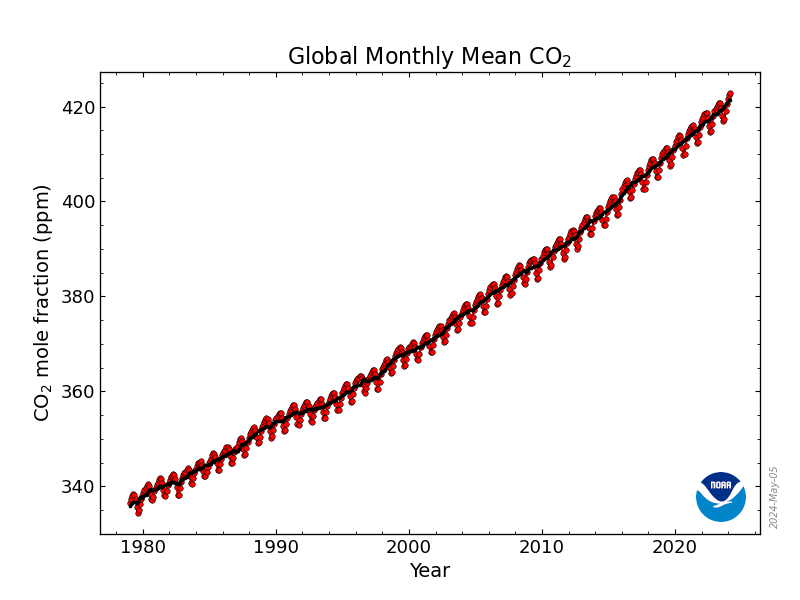 |
| CO2 air concentration (Keeling curve) |
 the CO2 concentration in the atmosphere depens on it's sources, buffers and sinks. The sources can be separated into natural and man derived (see additional reading). Respiration of animals and plants and decay of organic matter can be considered natural sources whereas burning of fossil fuels are antropogenic sources. The sinks are the atmosphere (measurable), the ocean (measurable) and the land surface vegetation (derived as the rest from the other sinks). The ocean sink is quite complex as the atmospheric CO2 equilibrate following Henry's Law with the top layer of the ocean. But an increase in oceanic dissolved carbon dioxide is buffered by it's euqilibrium reactions with carbonatic acid, bicarbonates and carbonates. The added aqueous CO2 equilibrates and increases the pH of the ocean as a result. This is balanced by the microalgae activity consuming the aqueous carbon dioxide but, as a large quantity of them is made out of calcium carbonates (cocolithophores), the increase in acidity might reduce or nullify this carbon sink, leading to a runaway acidifiaction and thus inability to store CO2 in the ocean. The land vegetation CO2 sink is linked to the photosinthesis of plants. It really only is sink if the CO2 does not get added back to the atmosphere through burning or decay of the organic matter. So any fossillized soils our conserved through sedimentary processes really act like long term sinks. This can include shallow marine or lacustral environments.
Carbon dioxide aside, methane is a way stronger greenhouse gas (about 20x) but is present is smaller quantities. It's sources are from natural wetland emissions (with a lot of anoxic decay of organic matter), agriculture with mainly cow exploitations, coal mines, shale fracking and a product of forest fires.
In order to monitor all these emissions, remote sensing using satellites seem the best option. It offers amazing coverage and takes little time to make measurements again on a global scale, enabeling it to see variations. The problems are that it only really accurately measure the top layer of the atmosphere and that it's resolution is lacking. This tool is thus the best for global monitoring and for targetting areas which might require more attention. It is critical that the data get's checked with ground based surveys. This can be done with either the TCCON standardizing network having stations in many developped countries, of with airborn surveys. The issues are that the station's locations are not forming an unified grid and that there are thus gaps in the validation networks, especially in deserts, remote areas, or places like central Africa. Even with those flaws, such research permitted to quantify the relative emissions compared to certain areas. For example, it permitted to quantify the emissions from wetlands, being a source around 30% of global methane.
The remote sensing of greenouse gases is usefull in order to better understand the natural emissions, buffers and sinks, which then in turn allow for a better understanding of which variations are of anthropogenic origin. With a better understanding of the human impact, it makes it possible to tackle the greenhouse gas increase.
Aditional readings:
Keeling curve https://www.esrl.noaa.gov/gmd/ccgg/trends/global.html
This is natre, this is unnature: reading the Keeling curve https://academic.oup.com/envhis/article-abstract/20/2/286/528915
No comments:
Post a Comment