Friday, 27 March 2020

The complexity of coulpling in fluid rich, high pressure, rock systems by Dr Florian Fusseis and his team

20/02/2020

The complexity of coulpling in fluid rich, high pressure, rock systems by Dr Florian Fusseis and his team

Type of setup used for an X-ray tomography (Fusseis et al 2012)
At high pressures, rock go through a lot of processes which can release fluids. Dewatering of sediments and metamorphic reactions are commun at these depths. The research Florian Fusseis and his team are working on tries to understand the links between the created porosity, the release and mouvent of the pressurised fluid, and the fracturing and deformations of the host rocks. The "coupling" refers to the complexity that all these paremeters are interlinked, and thus need to be understoond in a context where feedback plays a major role. The progress in this area of geosciences is key to understanding mechanisms behind slow-slip earthquakes, thin-skin tectonics, or ore formation. Slow-slip earthquakes refer to the deeper parts of megathrust earthquakes, which could be a factor of strain localization closer to the surface. This is key in order to better understand this devastating type of megathrust earthquake. The pressure fluids could potentially concentrate incompatible elements, and undertsanding the processes as to their transport could be key in finding new ore deposits.

Florian Fusseis and his team are using 2 types of experiments. The first is an older technique: the black box experiment. This involves placing a cylinder of rock sample in a chamber, put it at high pressures with an hydrolic press, and then watch the result. Here the first experiments were done in a simple system including only gypsum. Gypsum got chosen because it is believed to play a major role in lubricating km long detachment faults in thin-skin techtonics. The results showed an increase in porosity and fluid filling in the pores towards the edge of the chamber. The pressured fluids fractured the sample in a array a fractures. This technique is simple and relatively quick to realise, but the main issue is that the only data points are: the state of the rock cylinder before the pressure increase, and at the very end of the experiment. This lead to the term "black box" as it is not possible to look at what is happening in real time.

A result of an X-ray tomography in gypsum (Fusseis et al 2016)
These issues lead to the developpement of a new type of experiments, the X-ray tomography experiments. The developpement of this technique has started 2 years ago with Florian Fusseis and Ian Butler. The technique consists of making a small experiment chamber, but in a X-ray trensparent material. This is then placed in a bright X-ray source (for this experiment, the syncrotron of Bristol). This setup allow for imaging during the whole experiment, in 3D. In order to get a higher resolution on the fracture sequences, geophones are placed on the chamber. When the cracking sounds are deteced, the strain rates are slowed down.

Such a high time ans spatial resolution is revolutionary in this field. It does have the issue that the quantity of data produced is huge and takes a great amount of time and expertise to be analised. DHP student Berrit analysed with Florian Fusseis a sample of gypsum and halite. She derived a computer analysis method to automatically record the developpement of porosity using the X-ray images. This proved interesting in following the formation of stylolites at the gypsum/halite boundary. One early result is that the dissolution/precipitation creep seemed to happen on grater distances than was previously thought. But this research is still ongoing and these particular results are not published yet. More is yet to come. Truly, a facinating path for research as it is certain that a lot of discoveries can be made using this X-ray tomography technique.

Additional readings:

"A 4D view on the evolution of metamorphic dehydration" by John Bedford, Florian Fusseis, Henri Leclere, John Wheeler and Daniel Faulkner. Published in 2016

"Pore formation during dehydration of a polycrystalline gypsum sample observed and quantified in a time-series synchroton X-ray micro-tomography experiment" by Florian Fusseis, C. Shrank, J. Liu, A. Karrech, Llana-F'unez, X. Xiao, and K. Regenauer-Lieb. Published in 2012

Thursday, 26 March 2020

Using laboratory experiments to illuminate volcanic processes Jackie E.Kendrick

 31/10/2019

Using laboratory experiments to illuminate volcanic processes Jackie E.Kendrick

A new batch of lava developing on Cleveland Volcano has prompted scientists to raise the alert level. (Photo courtesy U.S. Geological Survey via Wikimedia Commons)
Lava dome in the crater of the Cleveland volcano, Iceland
People have been thriving alongside volcanoes with the rich soils and hydrothermal related them. But the volcanoes are also a threat to those comunities. Effusive volcanoes, with more basaltic lava, are less dangeous as the eruptions usually happen in the same predictable areas, are slover and cover a smaller area. The more dangerous eruptions are from explosive volcanoes with silica rich magmas, rich in volatiles. In these cases, the very viscous magma can form a lava dome blocking the main eruption conduit. In order to predict the next eruption, seismics are widely used to look at the rock fracturingas the new magma is injected. I the talk from Jackie E.Kendric, she pointed out the need to better understant the failure of volcanic rocks in order to predict the failure of lava domes or the presence of new pressure derived faults acting as new conduits during eruptions. Jackie E.Kendrick is a experimentalist and field geologist, researching in the domains of volcanology and geology at the University of Liverpool.

 Jackie pointed out how volcanoes are used in her field as Earth research labs. When the rocks in a volcano, especially near the top or in the lava dome, the addded stress leads to rupture which decreases pressure, allowing the volatiles to form bubbles and drive the magma to an explosive eruption. The aim is to understand the behaviour and cyclicity of this type of eruption. This leads to the study of what processes and properties controle the rupture of materials.

First, the parameters need to be defined as to what environment is considered. Lava domes are highly explosive and, for now, unpredictable. The main concern is that the system is hererogeneous, more data is needed to make accurate models. But for the overall volcano, if assuming an near homogenous material, the properties that controle the rupture of materials are well known.

Automatic Uniaxial and Triaxial test system, Mecánica de ...
Unconfined rock strengh test, reaching failure
Experiments were set up in order to understand the elasticic behaviour of the rocks. It is known that the porosity increases the closer the rocks are to failure and that the tensial strength is very low in rocks. The experiment was set up un order to have cyclic loading (load/unload cycles without failure) to probe the elasticity of hte material. This causes damage to the rock over time, which finally leads to the brittle destruction of the rock when it crumbles. This is different to simple tome dependent pressure, which causes creep. In the case of this experiment, the assumprion of the rock being homogeneous holds when looking at the lava dome as it formed in a singular event. The cyclic loading represents the damage done by low magnitude earthquakes (0.1 scale), frequly caused by the injection of new magma.

Strain rates are also important as slow strain rates causes the rocks to flow wereas hig strain rates drive the rocks to failure. As viscous magma tends to keep more fluid under strain, this leads to more fracturing, which in turn can lead to a trigger to explosions.

From in situ tomography analysis, under strain, the magma can flow rapidly as a fracture form. The crystal mush content seems to behave similar to clays at this pressure. This pressure dependance leads to the problem of strain localization. Usially, the colder, more viscous magma is on top, blocked by the lava dome. This can lead to a more plastic behaviour of the crystalizing magma at the base of the lava dome, thus affecting the fractures in the area.

Some questions are still unanswered and research is still going on. One of them is the fact the the friction caused by the earthquakes should provide heating locally. Does it promotes or prevent eruptions? Does it remelts some of the magma? would it make it easier or harder to slip ? The current hypothesis is that it would promote more friction, but it would be highly composition dependant (basaltic composition would flow, but Mt St Helene like lava composition is too viscous).
Additional parametes that could be accounted for in the future are the permeability of the system, the fracture morphology and the fracture healing mechanisms.

Wednesday, 25 March 2020

Lava flows: Theory, lab experiments and field data by Herbert Huppert

23/01/2020

Lava flows: Theory, lab experiments and field data by Herbert Huppert

 During lava flows, many material loss is experienced by inhabitants. But how does objects and topography alter the path of the lava flow? Are wall a valid option to protect to a certain extend important infrastructure like hospitals? Would there be any "dry spots" behind buildings allowing for the the safekeeping of valuable resources? All these are questions Herbert Huppert tries to answer with his modelling of lava flow behaviour.

Herbert Huppert is an australian researcher, now stationed at the University of Cambridge. His background is in geophysics and applied maths, which makes him proefficient in making mathematical and numerical models to apply to Earth science processes. Now his focus is in fluid dynamics, phase change in rocks and other Earth processes at Cambridge.

Dry spot depending on house orientation
The first experiment aims to visually look at the general behaviour of a lava-like fluid with general obstacles. In order to do so, a viscous fluid (in this case thickened golden syrup) is dumped in one go from the top of an inclined plane bounded by tall walls. Small model houses and wall are put on the path to try and see the effect it has on the flow path of the syrup. In the case of the small houses, the syrup first left a "dry spot" (area downhill of the house with no lava), but was quickly surrounded. Immediately downhill of it, the thickness of the syrup flow is smaller. The larger houses,
like churches and such did leave a dry spot downhill of them. Small walls seemed only mildly effective as they got quickly overrun by the syrup flow, only diviating the flow when it first hit the wall. The "infinitely" (too large to be overrun in this model) tall walls though proved very efficient in deviating the flow and providing a dry spot, possibly protecting a house from most the the damage. This experiment has obvious flaws such as the side walls concentrating the flow, the initial dump of syrup and the assumed viscosity and sise of the buildings. It still allowed for a conceptual model to base numerical models of, knowing that topography need to be accounted for on top of it.

Multiple mathematical models got derived to try and find the best geometries for deviating lava flows. The first is looking in 2D as a cross-section, along the path of the lava flow, with varying topography. When it is at a shallow angle, the flow can overcome the topographic high without a major change in thickness. With a steeper slope stopping the path, the lava will form a pond before overcoming the obstacle aas a thinner flow. This is does not represent all of reality as in 3D it would go around the obstacle if possible. This is why churches, often build at the top of a hill in a village, are less affected by lava flows.
2D model of topography inducing ponding within the lava flow
 The second mathematical model looks at how a viscous newtonian fluid flows around a "tall cylinder" (assumed infinite hight, cannot be overtopped). Even with lava being a non-newtonian fluid, the results from the mathematical model closely link field examples, thus making the assumption possible. This helped calibrating the viscosity of the lava in the model to fing realistic results.

The third mathematical model is, using the derived viscosity for lava, looking at the spread of the lava after a wedge. Here it is visible that the lava flow follows the object, but after a certain opening angle, the flow  behaves similarly in all cases. The tighter the angle in the opstructor, the bigger the dry spot.
behaviour of the lava after an angle in an obstructing object
 Herbert insisted that these experiments and mathematical models were nice but that the main thing that was lacking is field data from actual field geologists to check and refine the models. Some place have already placed dows a few walls in a preventive attempt to protect high risc buildings. My opinion is that, even though the prediction of dry spots is nice in order to limit damage to some valuable equipment, lava flows are far from being the most dangerous or damaging results of volcanic eruptions. Lava flows are, exept a few isolated cases, very slow and cover only a small area. Pyroclastic flows and ash related mud floods are way more dangerous and would need a bigger focus on prediction a remediations. They both are extremely fast and widespread results of explosive volcanism. Otherwise, nontherless a good example in modelling Earth preocesse with mathematical models.


Greenhouse gas remote sensing: from space, the sky, and the surface by Niel Humpage

13/03/2020

Greenhouse gas remote sensing: from space, the sky, and the surface by Niel Humpage

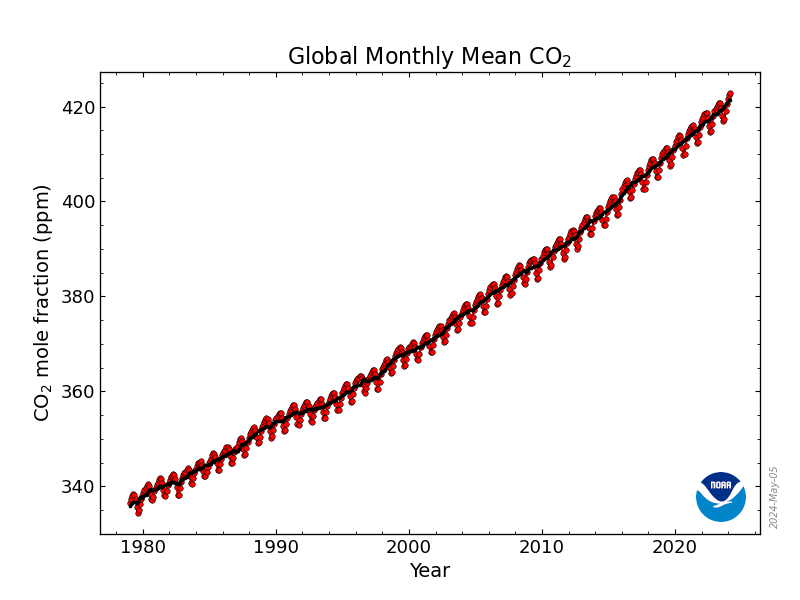
https://www.esrl.noaa.gov/gmd/webdata/ccgg/trends/co2_trend_all_gl.png
CO2 air concentration (Keeling curve)
 In order to better understand climate change, the detection and quntification of greenhouse gases is key. The most well known of them, CO2, has been monitored by the Mona Loa Global Monitoring Division since 1960 and is plotted as the Keeling curve. It shows a yearly cyclicity as well as a genral increase since 1960. In order to understand it's variations, a better understanding of the parameters that influence it's variations is needed. That is the first step that Niel Humpage explained during his talk on Friday 13th of March 2020 at Edinburgh. Niel Humpage is a researcher at the University of Liecester who has experience in remote sensing through his PHD at Imperial College London and since 2009 with the CEOI-ST, ESA and NERC projects at Liecester.

oceans | Topologic Oceans the CO2 concentration in the atmosphere depens on it's sources, buffers and sinks. The sources can be separated into natural and man derived (see additional reading). Respiration of animals and plants and decay of organic matter can be considered natural sources whereas burning of fossil fuels are antropogenic sources. The sinks are the atmosphere (measurable), the ocean (measurable) and the land surface vegetation (derived as the rest from the other sinks). The ocean sink is quite complex as the atmospheric CO2 equilibrate following Henry's Law with the top layer of the ocean. But an increase in oceanic dissolved carbon dioxide is buffered by it's euqilibrium reactions with carbonatic acid, bicarbonates and carbonates. The added aqueous CO2 equilibrates and increases the pH of the ocean as a result. This is balanced by the microalgae activity consuming the aqueous carbon dioxide but, as a large quantity of them is made out of calcium carbonates (cocolithophores), the increase in acidity might reduce or nullify this carbon sink, leading to a runaway acidifiaction and thus inability to store CO2 in the ocean. The land vegetation CO2 sink is linked to the photosinthesis of plants. It really only is sink if the CO2 does not get added back to the atmosphere through burning or decay of the organic matter. So any fossillized soils our conserved through sedimentary processes really act like long term sinks. This can include shallow marine or lacustral environments.

Carbon dioxide aside, methane is a way stronger greenhouse gas (about 20x) but is present is smaller quantities. It's sources are from natural wetland emissions (with a lot of anoxic decay of organic matter), agriculture with mainly cow exploitations, coal mines, shale fracking and a product of forest fires.

In order to monitor all these emissions, remote sensing using satellites seem the best option. It offers amazing coverage and takes little time to make measurements again on a global scale, enabeling it to see variations. The problems are that it only really accurately measure the top layer of the atmosphere and that it's resolution is lacking. This tool is thus the best for global monitoring and for targetting areas which might require more attention. It is critical that the data get's checked with ground based surveys. This can be done with either the TCCON standardizing network having stations in many developped countries, of with airborn surveys. The issues are that the station's locations are not forming an unified grid and that there are thus gaps in the validation networks, especially in deserts, remote areas, or places like central Africa. Even with those flaws, such research permitted to quantify the relative emissions compared to certain areas. For example, it permitted to quantify the emissions from wetlands, being a source around 30% of global methane.

The remote sensing of greenouse gases is usefull in order to better understand the natural emissions, buffers and sinks, which then in turn allow for a better understanding of which variations are of anthropogenic origin. With a better understanding of the human impact, it makes it possible to tackle the greenhouse gas increase.

Aditional readings:

Keeling curve https://www.esrl.noaa.gov/gmd/ccgg/trends/global.html

This is natre, this is unnature: reading the Keeling curve https://academic.oup.com/envhis/article-abstract/20/2/286/528915

Saturday, 30 November 2019

Variable magma and carbon fluxes at mid-ocean ridges by David Rees Jones

21/11/2019
Eyjafjallajokull volcano in Iceland

Variable magma and carbon fluxes at mid-ocean ridges and on Iceland between glacial and interglacial cycles by David Rees Jones

Abstract:

David Rees Jones and his team looked at the influence of glacial and inter-glacial cycles on the melt production and composition at mid-ocean ridges. As the sea-level varies with the cycles the water column above the mid-ocean ridge varies thus leading is small changes in confining pressure. As the magma is formed by decompression melting the depth and percentage of melt is affected by variations of pressure thus responding to the glacial cycles. This studies tried to quantify this influence and it managed to achieve it for long periods but still overestimated it for shorter ones.

Main:

Mid-ocean ridge volcanis has been often looked at in the light of a driver of plate tectonics as well as a response to plate divergeance. Many previous studies have been realized in order to understand the processe involved with the formation of the magma at mid-ocean ridges and their compositions. Glacial and inter-glacial cycles are thought along wit hother factors to be a consequence of the variation in volcanic activity. The study conducted by David Rees Jones and his team composed of Nestor Cerpa, Rich Katz and John Rudge looks at the influence of the glacial and inter-glacial cycles on the formation and composition of the melt, which brings in a new feedback perspective.


David and his team already hade previous work experience in geodynamics. They looked at fluid mechanic related fields of work like the Earth's outer core magnetic processes or the understanding of glacial cycles. This gave them the background necessary to try and answer this question: "Does the glacial and inter-glacial cycles have an influence on magma production and composition at mid ocean ridges?".

First lets look at the basics of mid-oceanic ridge magma formation. The main process to create melt at mid ocean ridges is decompression melting. Decompression melting is the process where the asthenospher is hot enough to melt but the pressure keep it in solid state at greater depth. As it rizes towards the surface by convection the rock column above become smaller up to the point where the confining pressure drops enough to allow melt to form. Trough this process the fertile asthenosphere (lhertzolite) melts between 5% and 20% melt leaving depleted mantle rocks behind (hartzburgite). Because it is only partial melting there is a partition of elements between the solid (rock) and liquid phase (melt), which depends with the percentage of melt.

Then the climate cycles pattern needs to be understood. During the last 2 My there is a good record of sea surface temperatures illustrating glacial and inter-glacial cycles (from E.Lisiecki et al 2005 and Peter U. Clark et al 2006*). The cycles alternate with a rapid heating of the climate into an inter-glacial period with a slower cooling back into a glacial period. These cycles are on average 41 ky long before the Mid-Pleistocene where they switch to 100 ky cycles. These are thought to be linked with Milankivic cycles where ~40 ky corresponds to obliquity, and the ~100 ky cycles could correspond to the eccentricity having to most influence. But what could be the link with the mid-ocean ridge volcanism?
Variations of delta O18 from benthic foraminifera as a proxy for sea surface temperature during the last 3 Myr (from Peter U. Clark et al 2006). Up to ~1.5 Myr the cycles last ~41 ky but after the Mid-Pleistocene transition the cycles last ~100 ky. This is most likely caused by the relative inflence of Milankovic cycles.
Between ice ages the mean sea-level can have around 100m variations! This changes the water culumn that lies above the mid-ocean ridge which in turn changes the pressure gradient where decompression melting occur. During glacial periods the sea-level is lower, thus the pressure is also smaller which means that the decompression melting happens deeper, thus marginally increasing the melt %. The reverse would happen during an inter-glacial period. This would have an impact on the magma formation at the mid-ocean ridge thus creating a feedback on climate.
The melting by decompression only (without lowering the melting temperature with the help of water) is referred to as "dry melting". During dry melting the carbon gets concentrated in melt as it is incompatible. This results in volcanic gases that emane from the magma to be highly concentrated in CO2. This plays a direct role in climate regulation as it is a well known greenhouse gas.
By looking in the variations of CO2 composition of the melts, David and his team found that there was a 10 to 15 years lag between the sea-level change and the variation in the decompression melting depth response.
They made a model to quantify the melt production variation caused by sea-level change. This model seemed to be accurate for long periods but for shorter ones had the tendency to overstimate the melt production, up to twice the actual amount. This model thus sets a maximum to the melt production variation.

In Iceland, the same processes can be applied but the parameters are different as the water column change has less inluence now as the ridge is above sea-level but ice sheets now are an additional mass to take into account. An additional comprexity is the imput of the hot spot below Iceland. It is still difficult to quantify the influence of the glacial and inter-glacial cycles
on the melt production of iceland.

References and further readings:

*A Pliocene-Pleistocene stack of 57 globally distributed benthic D18O records by Lorraine E. Lisiecki and Maureen E. Raymo
The Middle Pleistocene transition: characteristics, mechanisms, and implications for long-term changes in atmospheric pCO2 by Peter U.Clark et al.

Saturday, 19 October 2019

Fate and transport of nanotechnology in groundwater by Ian Molnar

10/10/2019
A crystal clear lake in Canada suffering from sulfur dioxide poisonning

Fate and transport of nanotechnology in groundwater by Ian Molnar

In short:

Ian Molnar is a new lecturer to Edinburgh University from Canada with a background in civil engineering. He is a contaminant hydrogeologist currently researching the transport of nanoparticles in groundwater. His study is based on the nanoparticle modelling problem of the currently used Happel sphere model. His experimental work found that 40% of the nanoparticle mass was omitted in this model thus leading to an overestimation of the filtering capacity of soil and sand. His experiment hopes it will help on the underway development of a new model for nanoparticle flow.

Main:

Ian Molnar is a Canadian hydrogeologist with a background in civil engineering. He joined as lecturer at Edinburgh University this summer is is thus the third Ian in the department. While still in Canada, his research as a contaminant hydrogeologist included the study of the crystal clear lakes North of Lake Huron. In this case, some lakes where crystal clear due to the lack of bio-activity caused by the leaching of sulfur dioxide from the nearby industry. In the quartzite regions the lakes where dangerously high in sulfure dioxide and their pH dropped down to values up to 5, whereas in the pink granite regions the buffering system was higher so the lakes where less affected. But now Ian Molnar is focusing on the transport of nanoparticles in groundwater.


The modelling of the flow and capture of nanoparticles in groundwater is important for multiple aspects like the modelling and tracing of contaminants in groundwater or the design water treatment installations. Nanoparticles are defined as any particle with at least one dimension smaller than 100nm. These particles are abundant in our modernized world for example titanium dioxide (a strong UV absorbant), carbon nanotubes, silver nanoparticles (antimicrobial) drug container and so forth. The average production of nanoparticles is averaged to around 320 000 tons/year (Keller 2013) which leads to the question of where do they land afterwards? Most of them get into a landfill (189 000 t/y), soil (51 600 t/y), groundwater (69 200 t/y), and the rest in surface water.

With such a mass of contaminant it is needed to me able to model the transport at a regional scale. Some preliminary experiments where done on a bench-scale experiment, the soil-column and then compare the flow of particles with the now used models. The result is that the model overpredicted the filtering potential for the nanoparticles which can be dangerous as for example water treatment plants could unknowingly release contaminated water. So Ian Molnar tried to improve the model as the Colloid Filtration Theory seemed to be good for micron scale colloids but not for nanoparticles.

The base model is based on the Happel shere in cell model. This model consist of modelling the pore space to a grain with a thin water shell around (proportional to pore space). Then it calculated the probability of a particle injected on one side to collide with the grain and then remain attached to it or to just flow inside the water shell to the other side.

In order to correct this model for nanoparticles, Ian and his team wanted to image the flow of nanoparticles during the soil column experiment by X-ray Tomography. The resolution of X-ray Tomography is of 10 µm which is too big for imaging 100nm particles. So to solve this problem they used absorption-edge imaging which involves a difference imaging on either side of the K-edge energy of the particles. This technique leads to a 3D map of nanoparticles concentration.

So to check to Happel sphere model they checked the concentration of nanoparticles around grains up to 15 µm close (cannot more due to refraction problem). So they found out that 40% of the nanoparticles are outside the Happel fluid envelope. As this mass is outside the fluid envelope it does not interact as predicted in the model leading to overestimation.

The design and testing of a new model is underway and this study hopes to help in the making of it.

Saturday, 12 October 2019

What is Gemeology ? by Anu Manchanda

03/10/2019

What is gemology ? by Anu Manchanda

From the Gemology Institute of America (GIA), Anu Manchanda came presenting what gemology is. The GIA's aim is to promote knowledge about gems for companies, customers, graders, mines and sellers. Her short description of gemology would be that it is a blend of a few things: the study of gemstones as in applied crystallography, business as in industry and sales and markets, art for the jewellery aspect and finally a passion. She then described what it actually entails to be a gemologist.


Gemology is used by a range of professionals: retail sales professionals, appraisers, jewelry buyers, wholesalers, designers, manufacturers, trade journalists and research lagoratories for treatment of gemstones or synthetic manufacture. The production of synthetic gemstones is now very important in multiple field ranging from abraders in industry to scientific grade equipment.
At GIA, the gempstones are separated as diamonds and coloured gemstones groups as diamonds are regulated in a specific fashion. The GIA is involved with the trade market, gemstone identification, diamond and coloured gemstones grading, the basic optical and physical science relative to gemology and finally the sales techniques. She then discribed the steps they go through when they are handed in a gemstone.
First it is needed to identify the gemstone. The best tool for this first is tho use the naked eye where wth the right expertise ~50% of the work is aleady done. This is a prime quality for field and exploration gemologists. Then the similar gemstones are differentiated relative to their Refractive Index (RI) which is distinct per crystal. Then they are analysed through the microscope. These techniques permit to make the difference betweens look-alikes and synthetics, very important especially in the diamond trade.
The gemstones, if send for lucrative purposes, can be treated to overcome their shortcomming. Breaks or cracks can be filled by material with the same RI than the crystal of laser drilling can be used to remove impurities.
An important aspect as well is the grading of these gemstones, for coloured gemstones their colour, aside from their purity is a defining factor. Colour of the coloured gemstones are given a rank qua tone, hue and saturation which grately influence their final grade. The colours of cloured gemstones are directly linked to theire relative concentrations in impurities making certain tints very rare and thus very valuable.
For diamonds being transparant, other criteria are used for grading, notably the four C’s: colour, clarity, cut and carat. Depending on their Nitrogen content diamonds quand be slightly tinted. A slight tint would usually bring the value down of the product whereas a transparant of very deep clour will bring the price up. Clarity measures the proportion, shape and relief of the inclusions, focusing of the optic aspect. The cut is the man influence parameter and carat finally is relative to the size of the gem. The mine of origin can also have an impact on the price of the gem.
The exploitations of gemstones bring along multiple questions: the adventages and disadventages of industrial gems, the ethics in the mining, the environmental impact and the steps taken or yet to be taken to tackle those problem. Questions to which she failed to answer.